1. Click Home Icon from Menu.
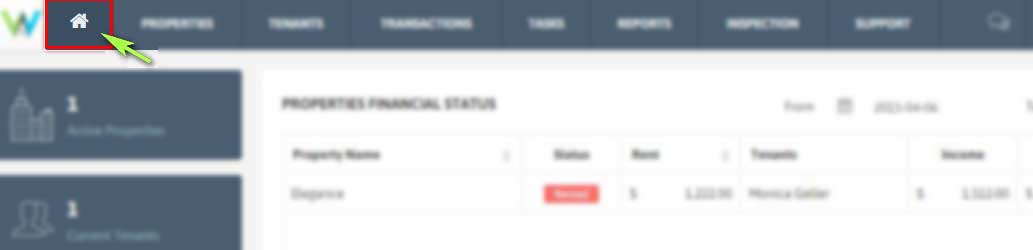
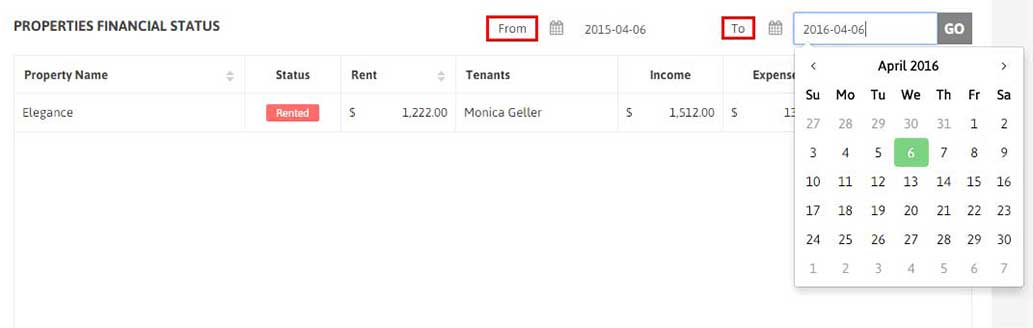
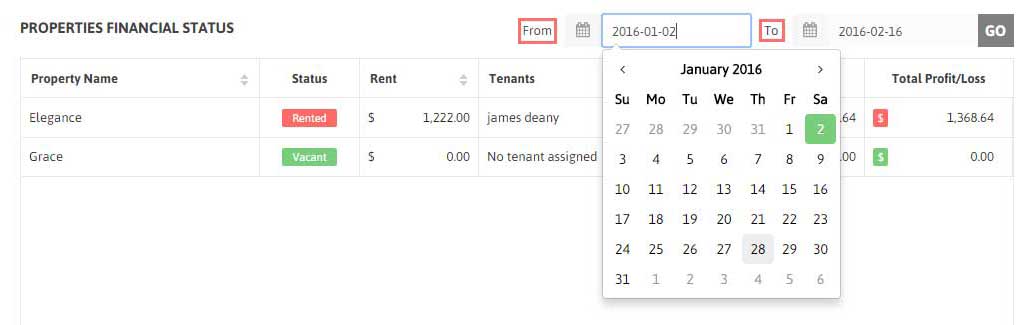
2. Set the Date range ‘From’ and ‘To’. It will display the Property name with lease date in between these dates also the result will show its status, rent, tenants assigned to it and income,expense data for it.
1. Click Home Icon from Menu.
2. Set the Date range ‘From’ and ‘To’. It will display the Property name with lease date in between these dates also the result will show its status, rent, tenants assigned to it and income,expense data for it.
1. Your Properties Financial Table displays the total income, expense of each property along with its details like status, rent amount, tenant assigned to it.
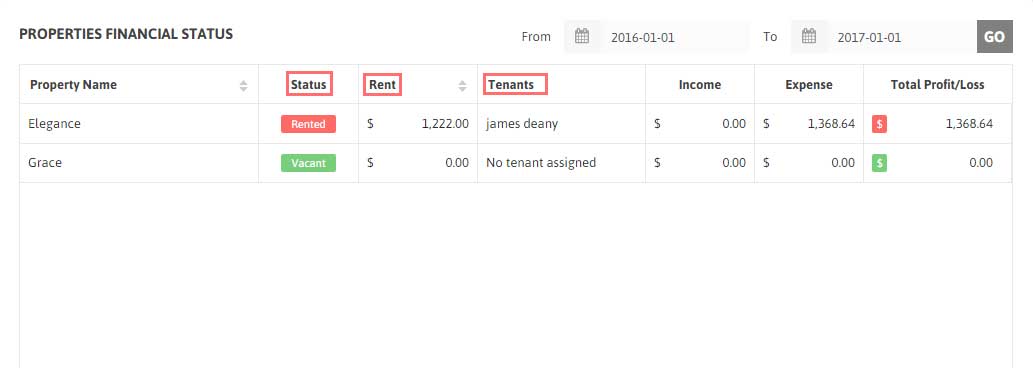
2. You can also see Total Profit and Loss for all of your properties in Properties Financial Table.
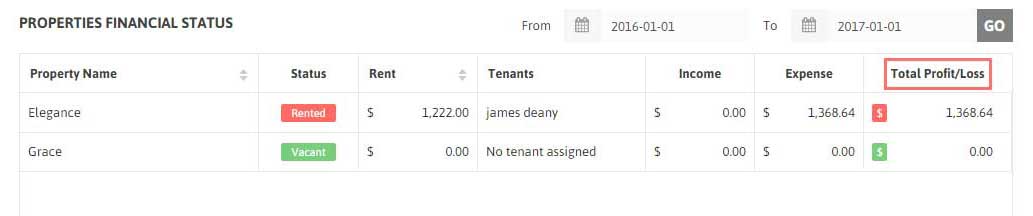
3. The table summarizes your Start Date to End Date Cash Flow.
4. Also you can easily compare the Total Profit/Loss of each of your Properties.
1. For more clarification of your total profit/loss ratio, You can check Income,Expense ratio through Graphical representation of Pie Chart.

2. To get more detailed information on your Income and Expense breakdown by the Property, visit the specific Property detail from Properties Tab on Top menu.
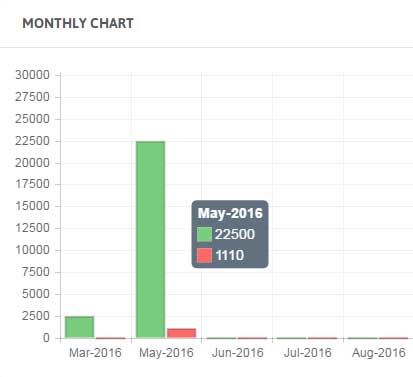
1. Monthly Chart is your Monthly Cashflow chart in bar graph representation to let you easily track your monthly expense and income growth.